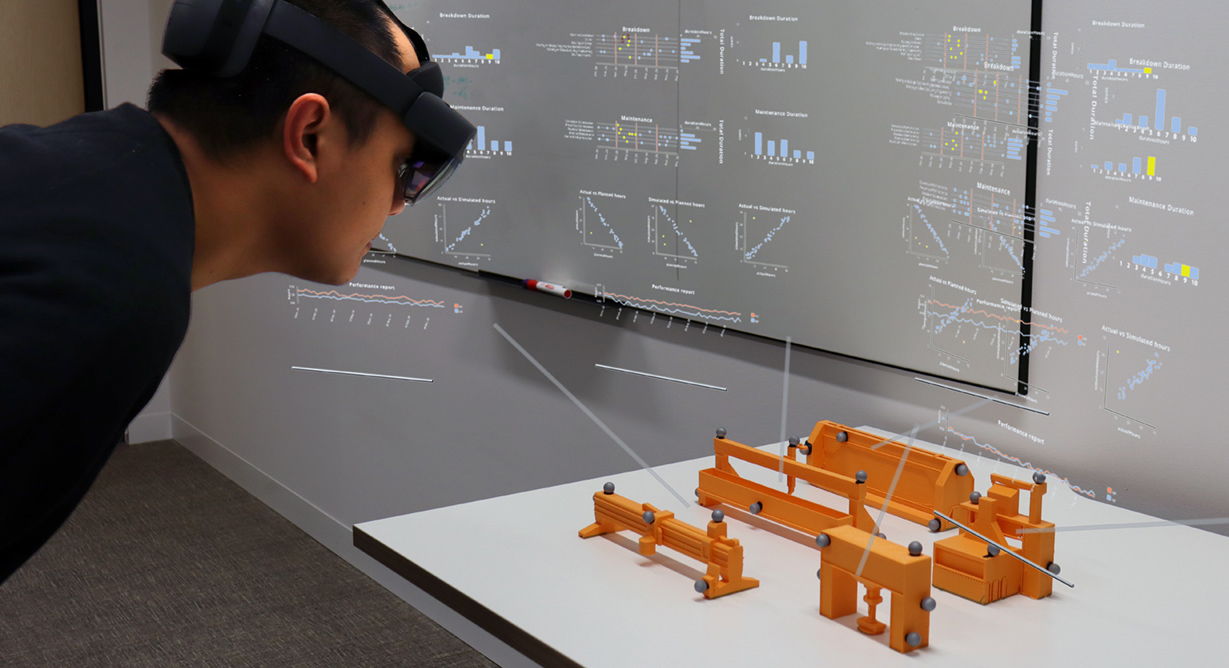
Augmented Scale Models: Presenting Multivariate Data Around Physical Scale Models in Augmented Reality

Kadek Ananta Satriadi, Andrew Cunningham, Bruce H. Thomas, Adam Drogemuller, Antoine Odi, Niki Patel, Cathlyn Aston, Ross T. Smith

Abstract

Recent research in immersive visualisations has explored the use of physical 3D models together with virtual data visualisations, with a simple data encoding. However, little is known about how this technique could be extended towards more complex multivariate data with multiple charts. We present augmented scale models, immersive visualisations that place charts of multivariate data via Augmented Reality (AR) registered to physical 3D models. We identified two main factors for presenting AR charts in the limited display space around the models: 1) how charts are laid out (Slides vs Dashboard), and 2) how the chart views are arranged in the 3D space (On Scale Model, On Table, On Virtual Board). In a within-subject user study, we evaluated these two design considerations. We found that chart layout and view arrangement do not affect task error but do vary in response time. Dashboard and Slides perform equally well on simple tasks that require comparison of a single chart across scale models. However, in more complex tasks such as comparing multiple charts within a scale model or across several scale models, Dashboard shows no decrease in time performance, while Slides’s time performance decreases significantly. We also found that On Scale Model has the fastest performance, has good chart-scale model integration, and supports charts comparison well. On Table and On Virtual Board on the other hand, show a trade-off between the ability to support charts comparison across models and the chart-scale model integration.

Physical scale models have been used for numerous applications in a wide ranges of fields. In recent years, augmented reality technologies have been explored for combining physical scale models with abstract data visualisation but there are many under-explored design challenges for such systems. In this work, we investigated two design factors: 1) charts layout factors that determines the way multiple charts are presented per scale model, and 2) view arrangement factor that determines how multiple chart views are arrange in limited space around physical scale models.

The six techniques we evaluated in our user study.

More info can be found in our paper.

Acknowledgement

This study was co-funded by the department of Industry, Science, Energy and Resources (Innovative Manufacturing CRC Ltd), and ASC Shipbuilding Pty. Ltd. (IMCRC/ASB/190720) in partnership with University of South Australia.